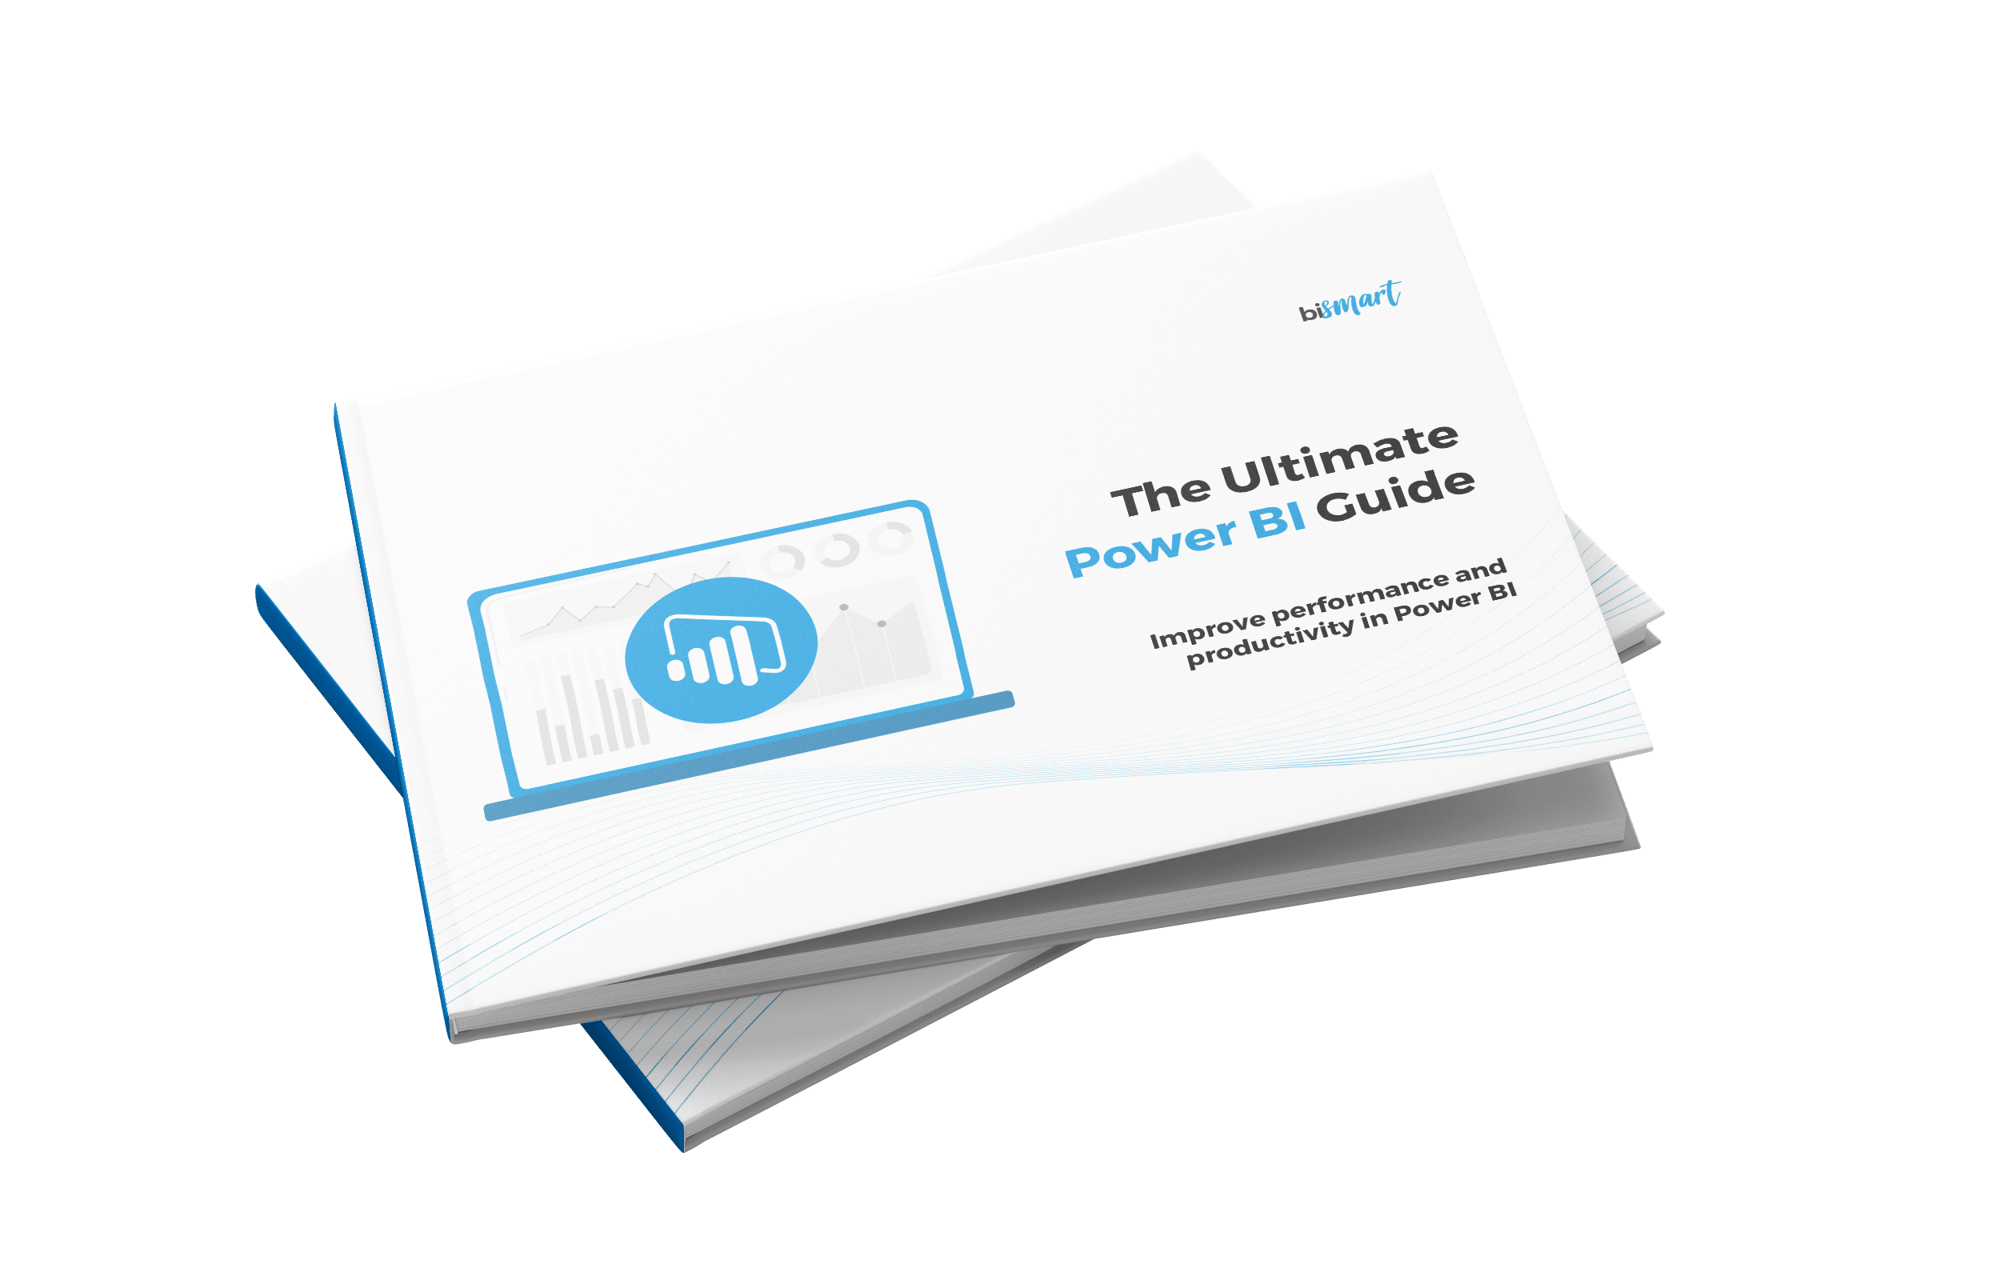
The Ultimate Guide for Power BI: Power BI Manual

Fill out the form to access the report
▶️ Learn the best practices in reporting and data visualisation for Power BI.
▶️ Learn how to save time by automating tasks such as creating themes in Power BI.
▶️ Discover how to save money while getting the most out of the tool.
Download the Complete Power BI Guide
Are you looking to learn how to use Power BI from scratch? Download our complete Power BI guide for free and transform your data analysis approach.
This Power BI manual is designed for both beginners and advanced users, offering you a step-by-step Power BI tutorial that will take you from the basics to advanced techniques.
What will you find in our Power BI guide?
- Introduction to Power BI: Learn what Power BI is and how it can help you make data-driven decisions.
- Power BI Desktop: Discover how to install and set up Power BI Desktop to start creating your first reports.
- Visualizations in Power BI: Master visualization tools to present your data effectively.
- Data Analysis with Power BI: Leverage the power of Power BI to conduct deep analyses and gain valuable insights.
- DAX in Power BI: Learn DAX formulas and functions to enhance your data analysis.
- Power Query in Power BI: Simplify data transformation and cleaning with Power Query.
- Power BI and Excel Integration: Connect your Power BI reports with your Excel spreadsheets for greater flexibility.
- Power BI Dashboards: Create interactive and customized dashboards to monitor your KPIs.
- Power BI Tips and Tricks: Discover best practices and strategies to optimize performance in Power BI.
Why choose our Power BI guide?
Our Power BI guide is not only comprehensive and detailed but also completely free. This downloadable Power BI document is available in PDF format, allowing you to access it anytime and anywhere. Additionally, we have included practical examples and exercises to help you immediately apply what you have learned.
We also offer comparisons and reviews of Power BI against other tools like Tableau, as well as data visualization strategies and the best Power BI visuals to help you get the most out of this powerful tool.
Complete and Detailed Content: From basic concepts to advanced techniques. Practical Examples: Immediate application of what you've learned. PDF Format: Easy and convenient access from any device. In Spanish: Ideal for users in Spain and Latin America.
Don't miss the opportunity to improve your skills and take your data analysis to the next level with Power BI.
Delving into Power BI: Key Features
Power BI stands out for its advanced data analysis and visualization capabilities, enabling organizations to transform complex data into interactive reports and intuitive dashboards.
Here are some of the most notable features of Power BI that will help you maximize the value of your data:
1. Connection to Multiple Data Sources
- Power BI can integrate with a wide variety of data sources, allowing you to unify information from different platforms in one place. Some of the most common sources include:
- Excel: Direct connection to your Excel spreadsheets for a smooth data transition.
- SQL Databases: Access to SQL Server databases for robust analyses.
- Azure: Integration with Microsoft Azure cloud services.
- Cloud Services: Connections to Google Analytics, Salesforce, and other cloud services.
2. Interactive Visualizations
Power BI's visualization tools allow you to create interactive charts, tables, and maps that make it easier to understand your data.
Key features include:
- Customizable Visualizations: Adjust charts and tables to suit your specific needs.
- Filters and Slicers: Use filters and slicers to explore different views of your data.
- Dashboards: Create personalized dashboards that display key metrics in real-time.
3. Power Query
Power Query is a powerful tool within Power BI that allows you to extract, transform, and load data (ETL) from multiple sources. With Power Query, you can:
- Data Transformation: Clean and transform your data to ensure its accuracy.
- Data Merging: Combine data from different sources for more comprehensive analysis.
- Process Automation: Automate data import and transformation processes to save time.
4. DAX (Data Analysis Expressions) Language
DAX is a formula language used in Power BI to perform calculations and create custom measures. With DAX, you can:
- Complex Calculations: Perform advanced calculations and create custom measures for detailed analysis.
- Time Functions: Use time functions to analyze trends and patterns in your data.
- Table Relationships: Define relationships between different tables for deeper analysis.
5. Power BI Service
Power BI Service is the cloud platform that allows you to share and collaborate on your reports and dashboards. Some advantages include:
- Real-Time Collaboration: Share your reports with colleagues and collaborate in real-time.
- Secure Publishing: Publish reports securely and control who has access to them.
- Automatic Updates: Keep your data up-to-date with the ability to automatically refresh reports from your data sources.
6. Integration with Excel
Power BI seamlessly integrates with Excel, allowing you to import data from spreadsheets and publish Excel reports directly in Power BI. This facilitates:
- Pivot Table Conversion: Convert your Excel pivot tables into interactive visualizations.
- Data Connection: Connect your Power BI reports with your Excel spreadsheets for greater flexibility.
- Excel Formulas: Leverage Excel formulas and functions within Power BI.
7. Power BI Mobile
With Power BI Mobile, you can access your reports and dashboards from anywhere. The mobile app offers:
Remote Access: View your data and key metrics while on the go. Full Interactivity: Interact with your reports and dashboards from your mobile device. Real-Time Notifications: Receive notifications and alerts about important changes in your data.
How to download the Power BI guide?
Simply fill out the form and you will get immediate access to the Power BI guide in PDF. Don’t miss the opportunity to enhance your skills and take your data analysis to the next level.
Download now and start your journey to mastering Power BI.