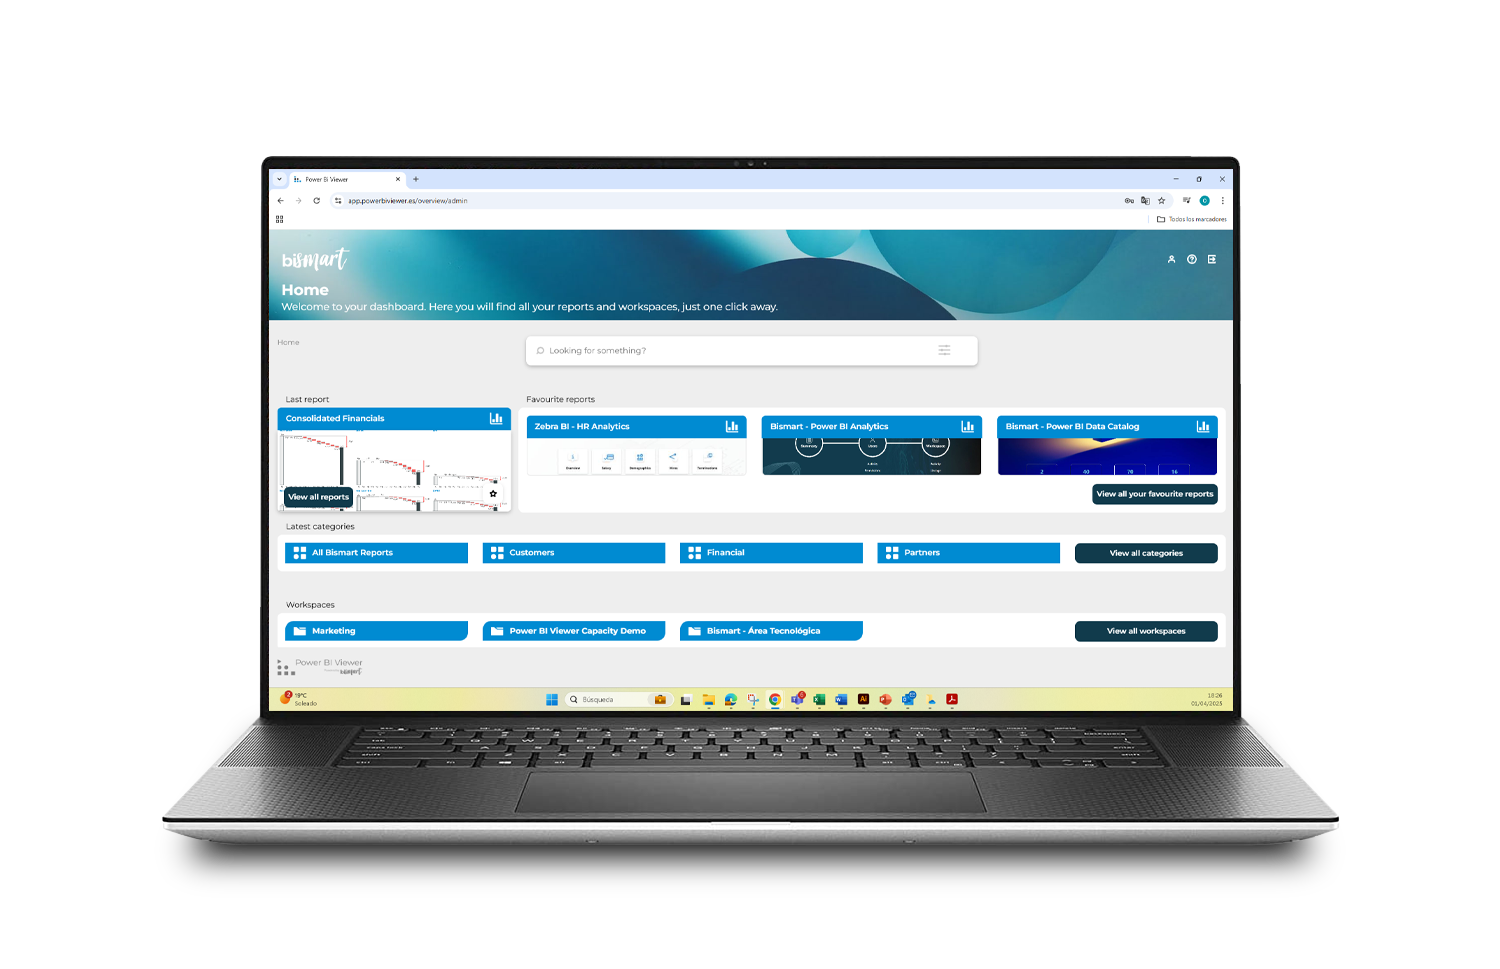
Power BI Viewer - Infographic

Get the complete infographic
▶️ Strengthen your Power BI environment with the best data governance and data management measures
▶️ Organise your environment to suit your needs
▶️ Establish which users can access which reports
Download the Power BI Viewer Infographic: Simplify Report and Dashboard Governance
Are you looking for an efficient solution to share Power BI reports without limitations? Discover how Power BI Viewer can transform the management and governance of your reports and dashboards with our detailed infographic.
What is Power BI Viewer?
Power BI Viewer is an innovative tool designed to simplify the management of Power BI reports. It allows you to share an unlimited number of reports and dashboards with internal and external users, regardless of whether they have a Power BI license. Moreover, it offers robust governance, providing different levels of access and autonomy according to your organization's needs.
Key Features of Power BI Viewer:
- Report and Dashboard Governance: Control who can view and edit reports with an intuitive Back Office environment. Define custom roles and permissions to ensure data security.
- Secure and Flexible Access: Share reports securely by applying restrictions and custom filters, ensuring that each user only accesses the data relevant to them.
- Efficient Organization: Categorize your reports by thematic or departmental categories to facilitate navigation and enhance user experience.
- Cost Savings on Licenses: Power BI Viewer allows you to share reports with users without the need to purchase multiple Power BI licenses, resulting in significant savings for your organization.
Download the Infographic of Power BI Viewer
Our infographic will give you a clear and concise view of how Power BI Viewer can improve the management of your reports and dashboards. Download it now to discover all the benefits!
Download the infographic and take your Power BI report management to the next level with Power BI Viewer.