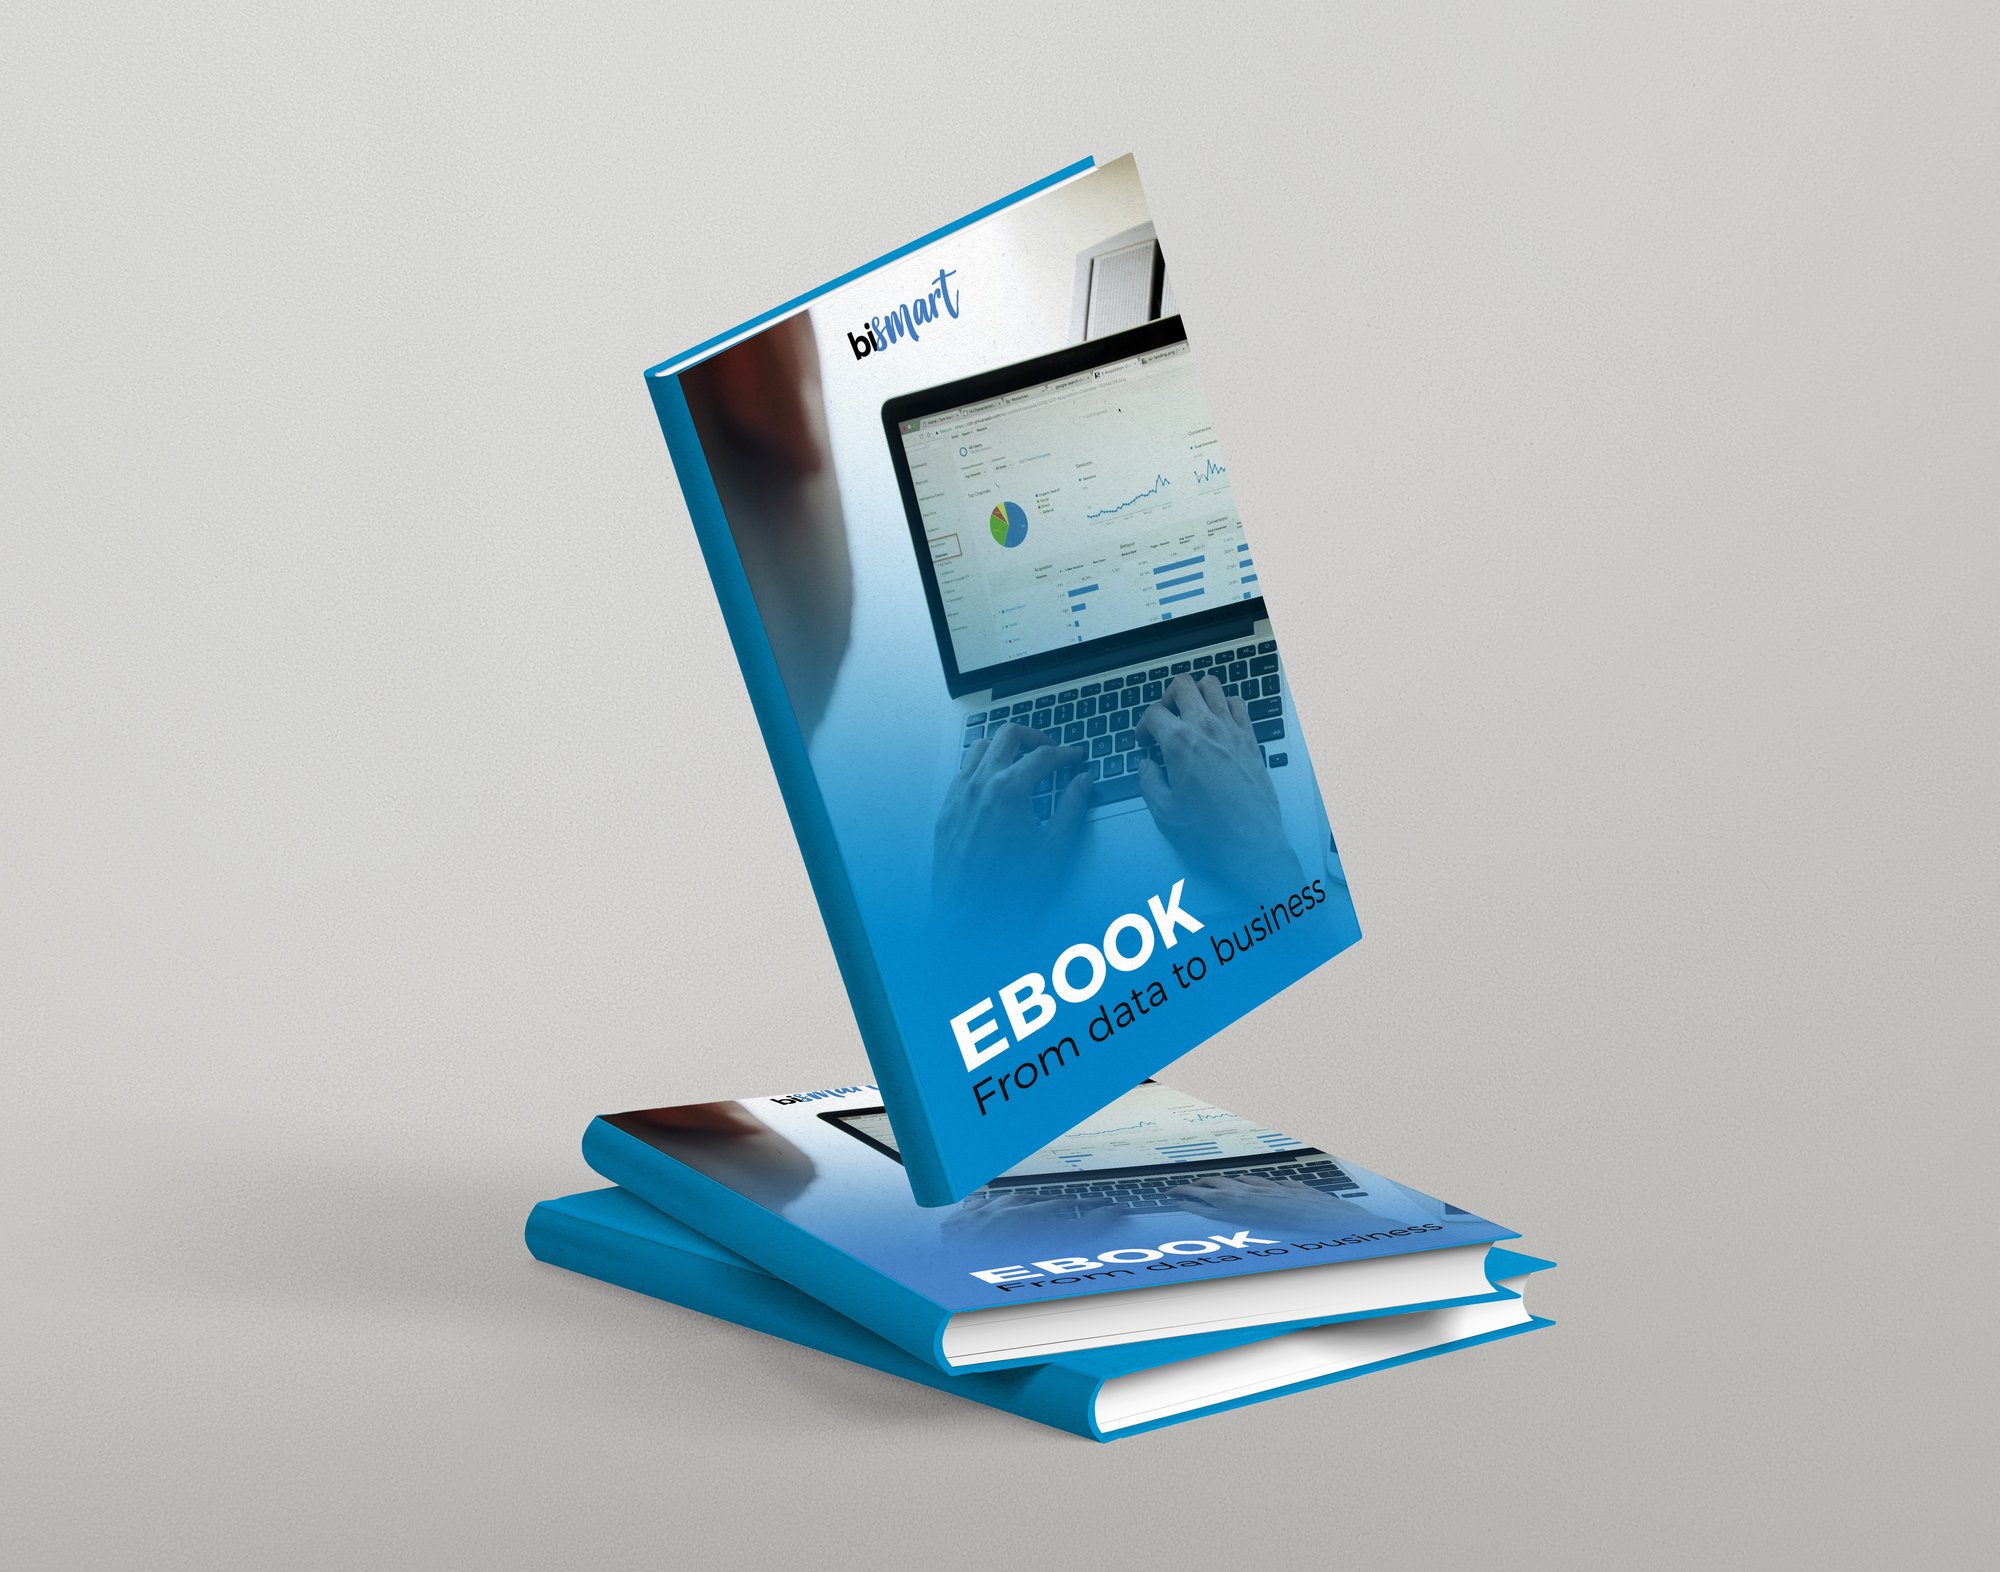
E-book: Top 15 Power BI Dashboards
At Bismart, we understand that each journey towards excellence in data-driven decisions is unique. Download our ebook and explore the best Power BI Dashboards and how to create them.

Read the complete ebook
▶️ Get inspired by the 15 most recommended Power BI Dashboards
▶️ Improve your existing dashboards with must-have metrics and KPIs
▶️ Optimise your strategic plan and action plan with examples of innovative dashboards
Unlock the Power of Data: Download Our Free Ebook
Discover the 15 Must-Have Power BI Dashboards
Data visualization is a crucial aspect of modern business intelligence. Our expertly curated ebook, "The 15 Must-Have Power BI Dashboards" is designed to elevate your data analysis capabilities.
Whether you're a beginner or an advanced user, this resource provides valuable insights and templates to enhance your Power BI skills.
What's Inside the Ebook?
Our ebook is packed with top-tier dashboard examples, each tailored to meet specific business needs. Here’s a sneak peek:
1. Finance Dashboard
- Features: Tracks annual and quarterly budgets, expected income, current revenue, and costs.
- Use Case: Ideal for financial analysts and managers to monitor the financial health of the organization.

2. Sales Dashboard
- Features: Monitors current and quarterly sales, revenue per sale, and units sold by region and customer segment.
- Use Case: Perfect for sales teams to track performance and set targets.
3. Cost Optimization Dashboard
- Features: Analyzes current and historical costs, and tracks cost evolution.
- Use Case: Essential for cost management and operational efficiency.
4. Customer Segmentation Dashboard
- Features: Segments customers by demographics, behavior, and revenue.
- Use Case: Helps marketing teams tailor campaigns and improve customer engagement.
5. Customer Journey Dashboard
- Features: Maps out the customer journey stages, including conversion and churn rates.
- Use Case: Useful for understanding customer behavior and improving conversion rates.
6. ABC Client Analysis Dashboard
- Features: Analyzes customer portfolio, turnover, and gross margin.
- Use Case: Assists in identifying high-value customers and optimizing business strategies.
7. Marketing Insights Dashboard
- Features: Tracks annual marketing budget, campaign success, and lead generation.
- Use Case: Crucial for measuring the effectiveness of marketing efforts.
8. Social Media Engagement Dashboard
- Features: Monitors interactions, engagement, and sentiment analysis on social media platforms.
- Use Case: Ideal for social media managers to gauge campaign success and audience sentiment.

9. Team Performance Dashboard
- Features: Tracks departmental performance, productivity, and budget allocation.
- Use Case: Useful for HR and management to monitor team efficiency and productivity.
10. Cross-selling & Up-selling Dashboard
- Features: Identifies opportunities for cross-selling and up-selling using AI capabilities.
- Use Case: Boosts revenue by recommending products to existing customers.
11. Hotel Management Dashboard
- Features: Unifies data related to hotel management, including revenue, occupancy, and market trends.
- Use Case: Helps hotel managers oversee all functional areas and optimize operations.
12. Power BI Viewer
- Features: Allows visualization of all company reports from a single customizable space.
- Use Case: Streamlines data governance and security while saving costs on licenses.
13. Power BI Analytics
- Features: Analyzes all activity recorded in Power BI Service with an unlimited historical repository.
- Use Case: Enhances user productivity and monitors business activity over any time period.
14. Power BI Data Catalog
- Features: Self-documents datasets and complements them with functional descriptions.
- Use Case: Empowers business users to create reports without technical assistance.
Why Download This Ebook?
- Expertly Curated Dashboards: Each dashboard is designed by industry experts to provide maximum insights.
- Interactive and Customizable: Templates are fully interactive and can be customized to fit your specific needs.
- Comprehensive Use Cases: Learn how each dashboard can be applied across different industries and functions.


