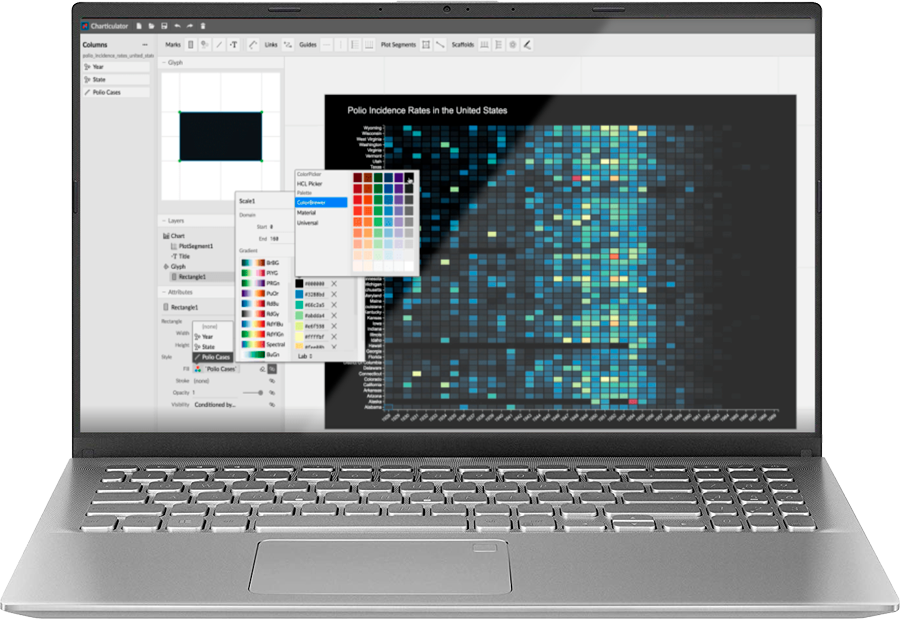
Discover How To Create Custom Visuals Without Writing a Single Line of Code

Download the guide
▶️ The capability to create complex, highly customizable graphics without coding.
▶️ Easy integration with Power BI to enhance your reporting.
▶️ An accessible and effective tool for any data-driven professional.
Complete Charticulator Guide: Create Visualizations Without Code
Charticulator is a tool that facilitates the creation of custom visuals or graphics without the need to write code. This tool overcomes the limitations of other approaches that allow very basic visuals or are conditioned by the programming knowledge of the technician.
Leave us your e-mail address so that we can send you a copy of our guide directly to your inbox.
Charticulator is rapidly becoming an essential tool for data analysts, Business Intelligence (BI) specialists, and professionals needing to create advanced visualizations without deep programming skills. Discover in this comprehensive guide how to fully leverage this innovative tool.
What is Charticulator and What is it Used For?
Charticulator is a platform developed by Microsoft that enables the creation of customized, interactive graphics without writing code. Unlike traditional tools like D3.js, Charticulator removes technical barriers by allowing visual design based on mathematical constraints, greatly simplifying the process of creating complex charts.
Key Benefits of Charticulator:
- No-code creation: Design visuals interactively and visually.
- High visual customization: More advanced than standard charts offered by other platforms.
- User-friendly: Intuitive interface resembling graphic design tools like Adobe InDesign.
- Flexibility and power: Easily adaptable graphics for new datasets without complex modifications.
Why Use Charticulator Instead of Other Tools?
Charticulator provides an intermediate solution between highly technical tools like D3.js and basic visualization platforms. Thanks to its constraint-based design approach, it offers superior flexibility and customization with a reduced learning curve.
Quick Comparison with Other Tools:
- Charticulator vs. D3.js: Lower technical complexity and no programming needed.
- Charticulator vs. Data Illustrator or Lyra: Higher level of customization with a similar number of interactions.
Integration with Power BI: Enhance Your Dashboards
One significant advantage of Charticulator is its seamless integration with Power BI. You can directly import data from your existing Power BI models to create visually impactful, highly customized graphics.
Benefits of Integrating Charticulator with Power BI:
- Direct use of Power BI data: Simplified access to your data models.
- Advanced dashboard visuals: Interactive graphics that enhance the visual quality and functionality of your reports.
- Reusable templates: Export graphic designs as templates for multiple reports.
Who Should Use Charticulator?
Charticulator is especially suited for:
- Business Intelligence analysts and consultants
- Digital marketing and market analysis professionals
- Users needing advanced visualization without extensive programming skills
Getting Started with Charticulator
Microsoft provides accessible educational resources to quickly and effectively learn Charticulator, including detailed step-by-step webinars.
Featured Resources:
- Mike Carlo Webinar: Complete tutorial to get started with Charticulator in Power BI.
- Official Documentation: Detailed guides provided by Microsoft.
Conclusion: Why Choose Charticulator?
Charticulator revolutionizes data visualization by offering:
- The capability to create complex, highly customizable graphics without coding.
- Easy integration with Power BI to enhance your reporting.
- An accessible and effective tool for any data-driven professional.
Download our Complete Charticulator Guide now and start creating powerful visualizations without writing a single line of code.
Ready to transform your data visualizations?
Download our complete Charticulator guide for free now.